loon
Summary
loon is an interactive data visualization toolkit. Currently loon has the following displays implemented
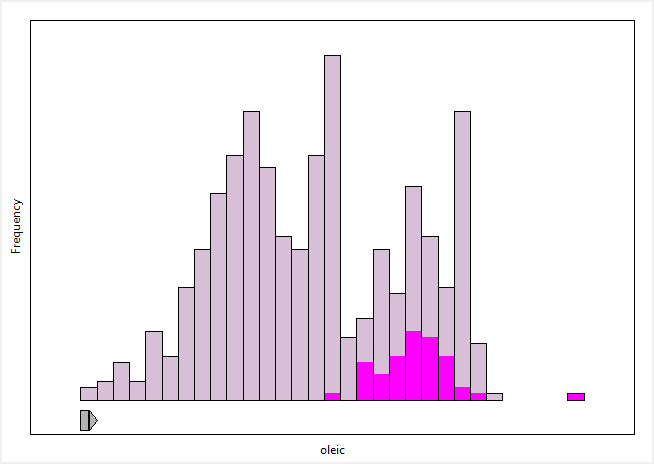
- histogram
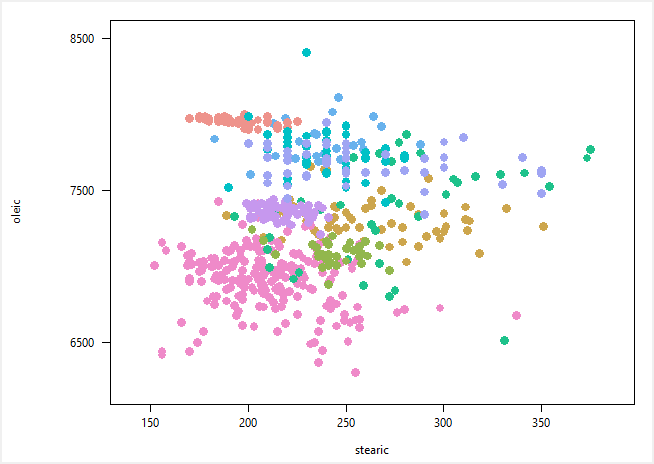
- scatterplot
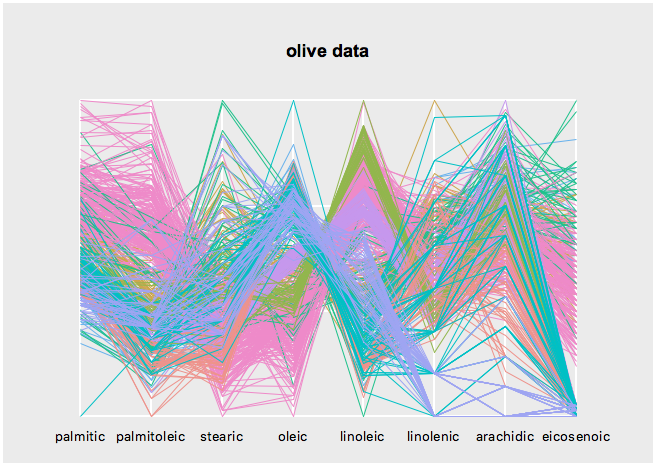
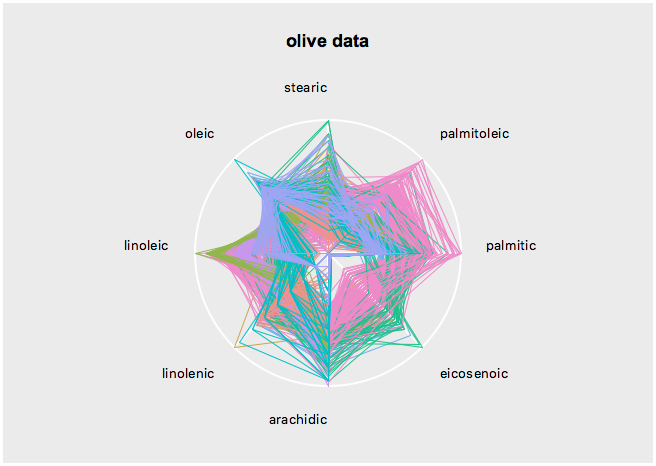
- serialaxes display (stacked star glyphs and parallel coordinates)
- graph display
The histogram, scatterplot and graph displays support zooming, panning and layering of visuals. All displays support linking and various event bindings.
Attributes
- Name
- loon
- Author
- Adrian Waddell and R.W. Oldford
- License
- GPL-2
- Documentation
- http://great-northern-diver.github.io/loon/l_help/
- Categories
- Interactive Data Visualization, GUIs
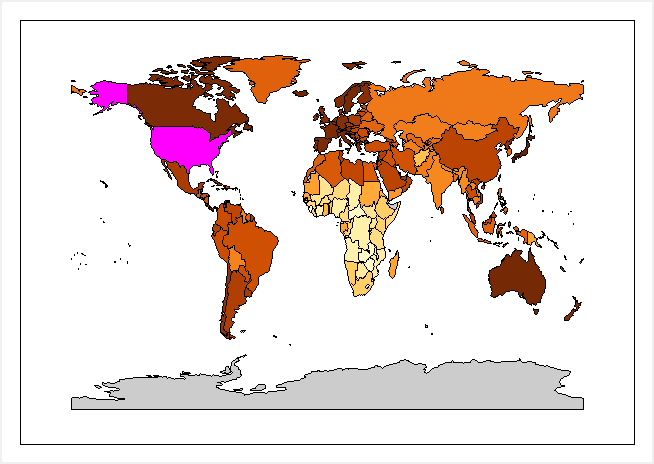
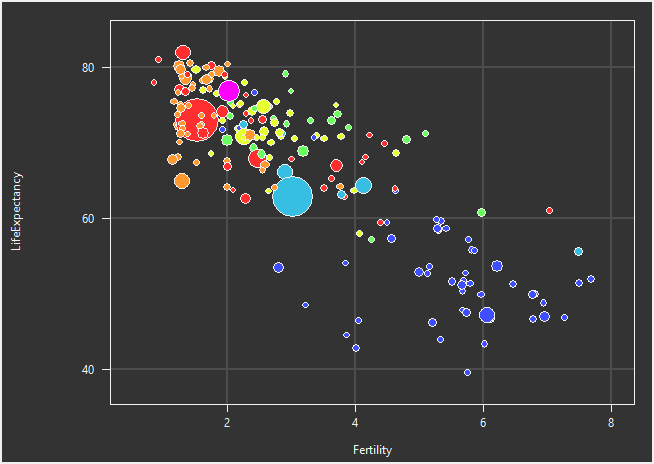
Some Sample Plots