Tclodbc + BLT
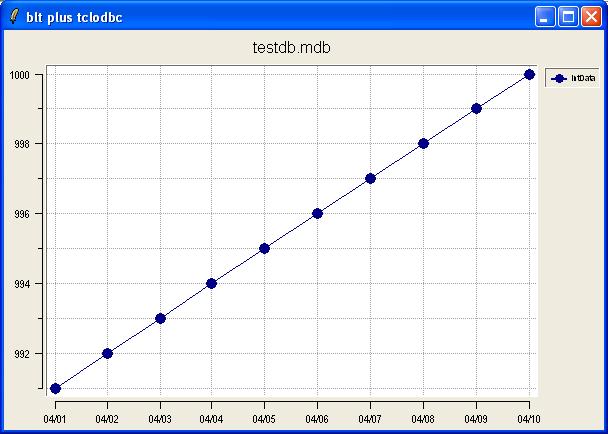
JM Dec-20-2010. The Tclodbc package includes some demos which creates and populates a database (testdb.mdb).
This time, I put together this simple script which reads the table (Table1) and creates a chart out of the result using BLT. Just copy this script in the tclodbc's "samples" folder, launch it and you will get the following output:
package require tclodbc
package require BLT

console show

proc fmt {graph sec} {
    return [clock format $sec -format {%m/%d}]
}

proc makeGraph {w x y} {
    global dbfile

    $w element create "IntData" -xdata x -ydata y -pixels 8
    $w grid configure -hide no
    $w configure -title $dbfile
    $w axis configure x -majorticks [x range 0 end]

    # Format the x-axis tick labels as Month/Day
    $w axis configure x -command fmt
}

proc connectToDatabase {} {
    global db driver dbfile
    if {[file exists $dbfile]} {
        #database connect db "DRIVER=$driver;DBQ=$dbfile;SystemDB=$mdw;UID=$user;PWD=$password"
        database connect db "DRIVER=$driver;DBQ=$dbfile"
    } else {
        tk_messageBox -message "path does not exist"
        exit
    }
    puts "connected to $dbfile"
}

proc GetTheData {} {
    global db x y
    blt::vector create x
    blt::vector create y

    db statement stmt "SELECT DateData,IntData FROM Table1 WHERE IntData > 990;"

    #set allRcds [stmt run]
    #set cuantos [llength $allRcds]

    stmt execute

    while {[set row [stmt fetch]] != {}} {
        foreach param {fecha entero} v $row {
            if {$param == "entero"} {
                set y(++end) $v
            }
            if {$param == "fecha"} {
                set x(++end) [clock scan $v]
            }
        }
    }
}

#1.-driver
set driver "Microsoft Access Driver (*.mdb)"
#2.-Path de la BDD
set dbfile "testdb.mdb"

::blt::graph .g -title "Yield: $dbfile" -width 600 -height 400
pack .g

connectToDatabase
GetTheData
makeGraph .g x y
stmt drop
db disconnect