throw a dice
Page by Theo Verelst
Not intended as another tcl or tk gem, but quite seriously, lets make tcl throw dice, and see where we get.
The function most easy to use for this (but unfortunately with predictable results when we know the seed,) is of course a subfunction of expr called rand .
To see how pure our die is, we simply throw it many times and see how often the sides come up, or to make it a bit more interesting, we take a die which supposedly has a hundred sides it can roll on, and see how many times each side comes up, and draw a graph of the result.
 set to {};
 for {set j 0} {$j < 100} {incr j} {
    set o 0;
    for {set i 0} {$i < 100} {incr i} {
       set o [expr $o+rand()]
    };
    lappend to $o
 }
A hundred times a hundred throws on a row, with the averages stored in a list in variable to. Now let's draw the results to scale, rounding to whole numbers in a little graph:
 canvas .c
 pack .c -expand y -fill both

 for {set i 0} {$i < [llength $to]} {incr i} {
    .c create line $i 100 $i [expr 100-[lindex $to $i]] -tag g1
 }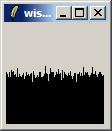
For electronicists probably a perfect enough little distribution graph, no unlikely things like a hundred events with expectation value of 0.5 adding up to very far from 50, no clear patterns, clearly a near white noise source.
Now let's analyze the distribution of the averages, by making a (sampled) distribution graph, which the values in this graph are limited to whole numbers, and the relative frequency of all occuring results plotted, to see if we get near the theoretical 'normal' or gaussian distribution.
I'll make a new page on Gaussian Distribution.
Also see Throwing Two Dice.
What is the relevance of this subject? First it's fun to do these things in tcl, it's a whole lot of work in other environments, and not a quarter of the fun.
Main line scientific applications are:
- quantum physics theory
- electronical circuit analysis
- quantized signal analysis
- in the physicists sense but less elevated: all measurement based data bein processed
- event systems, where usually the distribution of events has well defines statistical sides to it
- System analysis, where a lot of crap can be prevented by getting you statistics right.
TP Not so random coin toss: http://www.npr.org/features/feature.php?wfId=1697475
The audio available on this page is worth a listen.
FW: There is such thing as a 100-sided (d100) die. See Zocchihedra
RFox - 2012-06-20 18:21:28
This example (dice) will actually give a binomial distribution not a Gaussian distribution if I remember my statistics correctly. The binomial distribution will approach the Gaussian in the limit as the number of bins goes to infinity.
There's quite a lot more to uniform randomness than a flat distribution of values.. similarly there's a lot more to Gaussian randoms than just the distribution of values. One of the big problems in getting a good pseudo random number generator is how to ensure the dependencies between one 'die roll' and the next are independent. In the second volume of Knuth's The Art of Computer Programming Seminumerical Algorithms, fully 150 pages (about 1/4 of that 600pg tome) is dedicated to the problem of random number generation and the majority of that to statistical tests of randomizers.
I imagine that since probably KBK had a role in defining the Tcl randomizer that it's a Linear Congruential method with very well chosen modulus and multipliers.
A good way to get true random numbers is to use physical processes that are actually random, such as electronic noise or the time between decays of a radioactive substance (those time intervals have a Poisson distribution). This too is within the realm of Tcl..if we apply the http package to e.g. http://www.fourmilab.ch/hotbits/ and its links to fetch random bits, which uses the time between ticks in a GM counter counting background radiation.